Exclusive: This is how much energy bills will rise in your suburb

Electricity prices will rise by 20-25% on 1 July, but how much more will you pay? Our research shows the new typical prices in your suburb.
As the new financial year kicks in, energy bills are going up again.
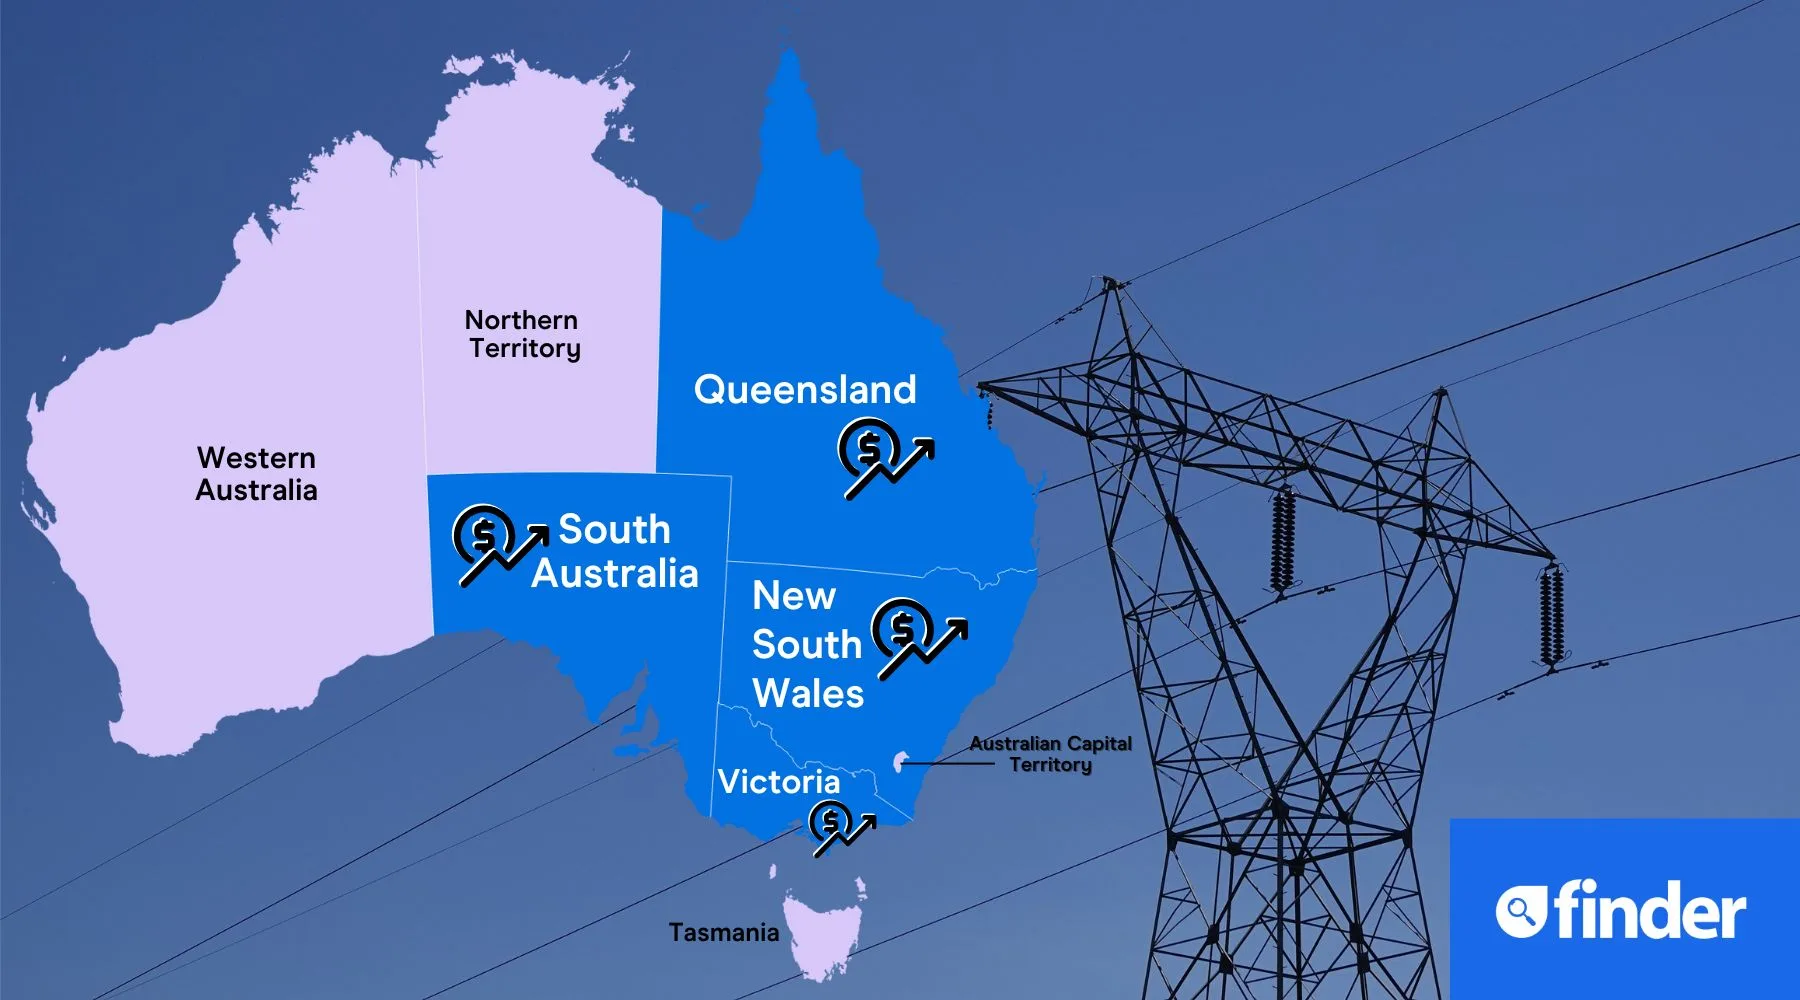
Benchmark prices (the maximum retailers can charge) are being raised by energy regulators in NSW, Victoria, South Australia and southeast Queensland from 1 July 2023.
But what does that look like where you live? Use our calculators to find out.
Jump to your state
What will energy bills looks like for my postcode from 1 July?
For these tables, we looked at annual estimates for 2-3 person households on a standing offer, single-rate tariff plan across postcodes in NSW, Victoria, South Australia and southeast Queensland. On this tariff type, usage charges stay the same regardless of time of day.
We applied the percentage increase in power prices approved by energy regulators to show how much these could go up by from 1 July.
Keep in mind: The actual increase can vary between households depending on energy consumption and whether you're on a standing offer or a market offer. If you haven't switched providers in the last 12 months, you're most likely on a standing offer.
New South Wales
NSW suburbs serviced by the Endeavour energy grid will be hit the hardest with a 23.15% increase. That grid covers 112 NSW postcodes. Our analysis suggests those in south-western Sydney, western Sydney, the Southern Highlands and the Blue Mountains will be affected the worst.
A slightly smaller increase of 20.2% applies to suburbs on the Essential Energy grid. This services 260 NSW postcodes ranging from Broken Hill in the very west of the state to Urunga on the mid-north coast.
- New average electricity bill in NSW: $2,308 (up from $1,911)
- Worst impacted areas in NSW: $565 or 23.15% annual increase
- Least impacted areas in NSW: $275 or 20.2% annual increase
Enter your postcode or suburb in the search bar to see what your next bill could look like.
We've also grouped towns and cities on a map to provide a broader insight into energy bills in your area.
Victoria
VIC suburbs that are on the Jemena and Powercor energy grids will be worst off with a 27% increase. These 2 distributors service 313 postcodes between them. They mostly service postcodes throughout the west of Victoria all the way through to suburbs around the international airport.
The least affected Victorians will be those whose homes are powered by Citipower. That covers 27 postcodes (mostly suburbs surrounding Melbourne), which will see 22% increase.
- New average electricity bill in Victoria: : $1,817 (up from $1,438)
- Worst impacted areas in Victoria: $402 or 27% annual increase
- Least impacted areas in Victoria: $275 or 22% annual increase
Enter your suburb or postcode to see what your energy bills could look like in the new financial year.
We've also grouped towns and cities on a map so you can compare to other energy bills in your area.
South Australia
South Australians on the SA Power Network are facing a 24.6% increase with those living in rural areas hit the worst.
- New average electricity bill in South Australia: $2,146 (up from $1,722)
- Worst impacted areas in South Australia: $654 or 24.6% annual increase
- Least impacted areas in South Australia: $391 or 24.6% annual increase
Enter your suburb or postcode to see what your new bills could look like if you're on a standing offer.
We've also grouped towns and cities on a map so you can see how much other households in your area are being impacted.
Southeast Queensland
Those in southeast Queensland are serviced via Energex and every postcode in the area will see a $322 increase (up 21%) over the year.
- New average electricity bill in southeast Queensland: $1,910 (up from $1,588)
Type in your suburb or postcode to see what your bill could look like in the new financial year.
We've also grouped towns and cities on a map so you can see the impact on other households in your area.
Why is my energy bill so different?
These are average results, and your own bill is likely to be different. There are several possible reasons for this:
- Household energy consumption varies greatly depending on usage and how many live within a home.
- You may be on a market offer contract. This means your retailer could charge below or above the benchmark price.
- The percentage increase we've applied is a benchmark increase based on information provided by energy regulators. We've taken the average increase for households with or without controlled load. A controlled load is any type of specific appliance that requires separate metering. This includes hot water systems and pool pumps.
- Some suburbs and postcodes are covered by multiple distributors, so for these we applied an average percentage increase.
- The current annual estimate we took for each postcode was done so on Energy Made Easy (for NSW, SA and QLD) and Compare VIC. We applied the percentage increase to these figures that were obtained for the government comparison sites.
If you've been notified by your energy provider that your new plan prices are increasing, it's time to shop around for a better deal. This is especially true if your new plan prices are above the benchmark set by the energy regulator.
Type in your postcode and start comparing.

 NSW
NSW VIC
VIC QLD
QLD SA
SA